

The product, in depth
A clearer view of the systems behind the software.
Root is a standalone, self-hosted infrastructure monitoring demonstration by Cosilan Systems. It brings simulated server resources, service health, SQL workloads, alerts and activity logs into one interactive dashboard.
01 / The operating picture
A working view of infrastructure.
Root is a standalone, self-hosted infrastructure monitoring demonstration created for the Cosilan Systems portfolio. It explores how an operator can move from a broad view of an environment to the server, service or database that needs attention. The project combines interface design, realistic monitoring scenarios and working interactions in a small application that runs locally. Every server, address, metric and incident is synthetic; the dashboard does not connect to production infrastructure.
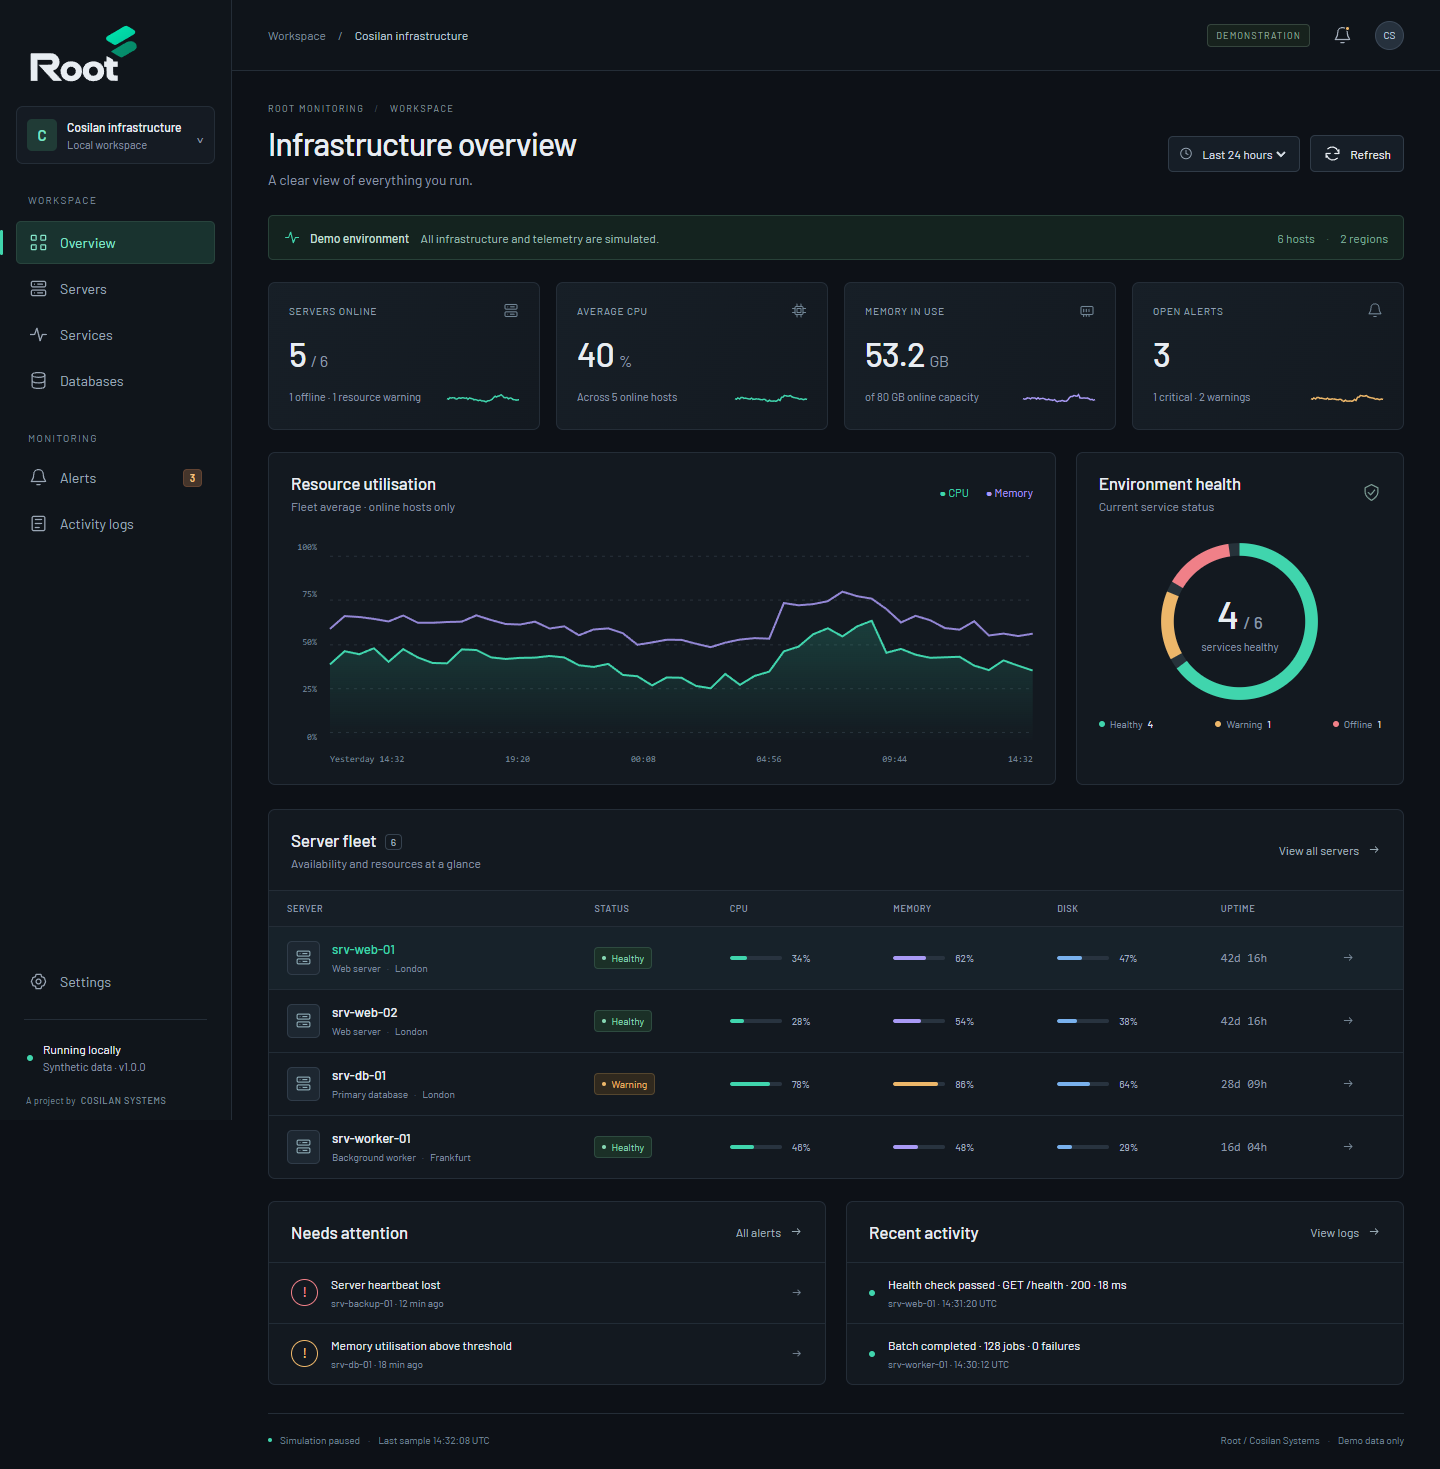
The overview establishes the environment immediately: six hosts across two illustrative European regions, five online servers, a resource warning and an unavailable backup host. Fleet CPU and memory history sit beside a service-health breakdown, followed by server resources, open incidents and recent events. These summaries give the operator several useful starting points. A high-level status becomes a route into investigation, while a persistent demonstration label makes the nature of the data clear throughout the experience.
02 / Exploring the fleet
A fleet that can be explored.
The server inventory brings availability, CPU, memory, disk usage and uptime into a consistent table. Hosts have recognisable roles: web delivery, a primary database, background processing, caching and backup storage. Their resource allocations vary to make comparisons useful. The online-memory total is calculated from the fixture records, and unavailable hosts show missing current CPU and memory values rather than implying that an offline machine is idle.
Status filters narrow the inventory to healthy, warning or offline hosts. Search works across the host information, and each row links directly to a dedicated detail screen. Empty results receive an explicit message, preserving context when a search matches nothing. The layout also considers smaller devices: tables scroll within their own containers, while navigation and summary cards adapt to the available width. This keeps the surrounding page usable without discarding the technical information that makes the inventory valuable.
03 / Investigating a host
From a warning to its host.
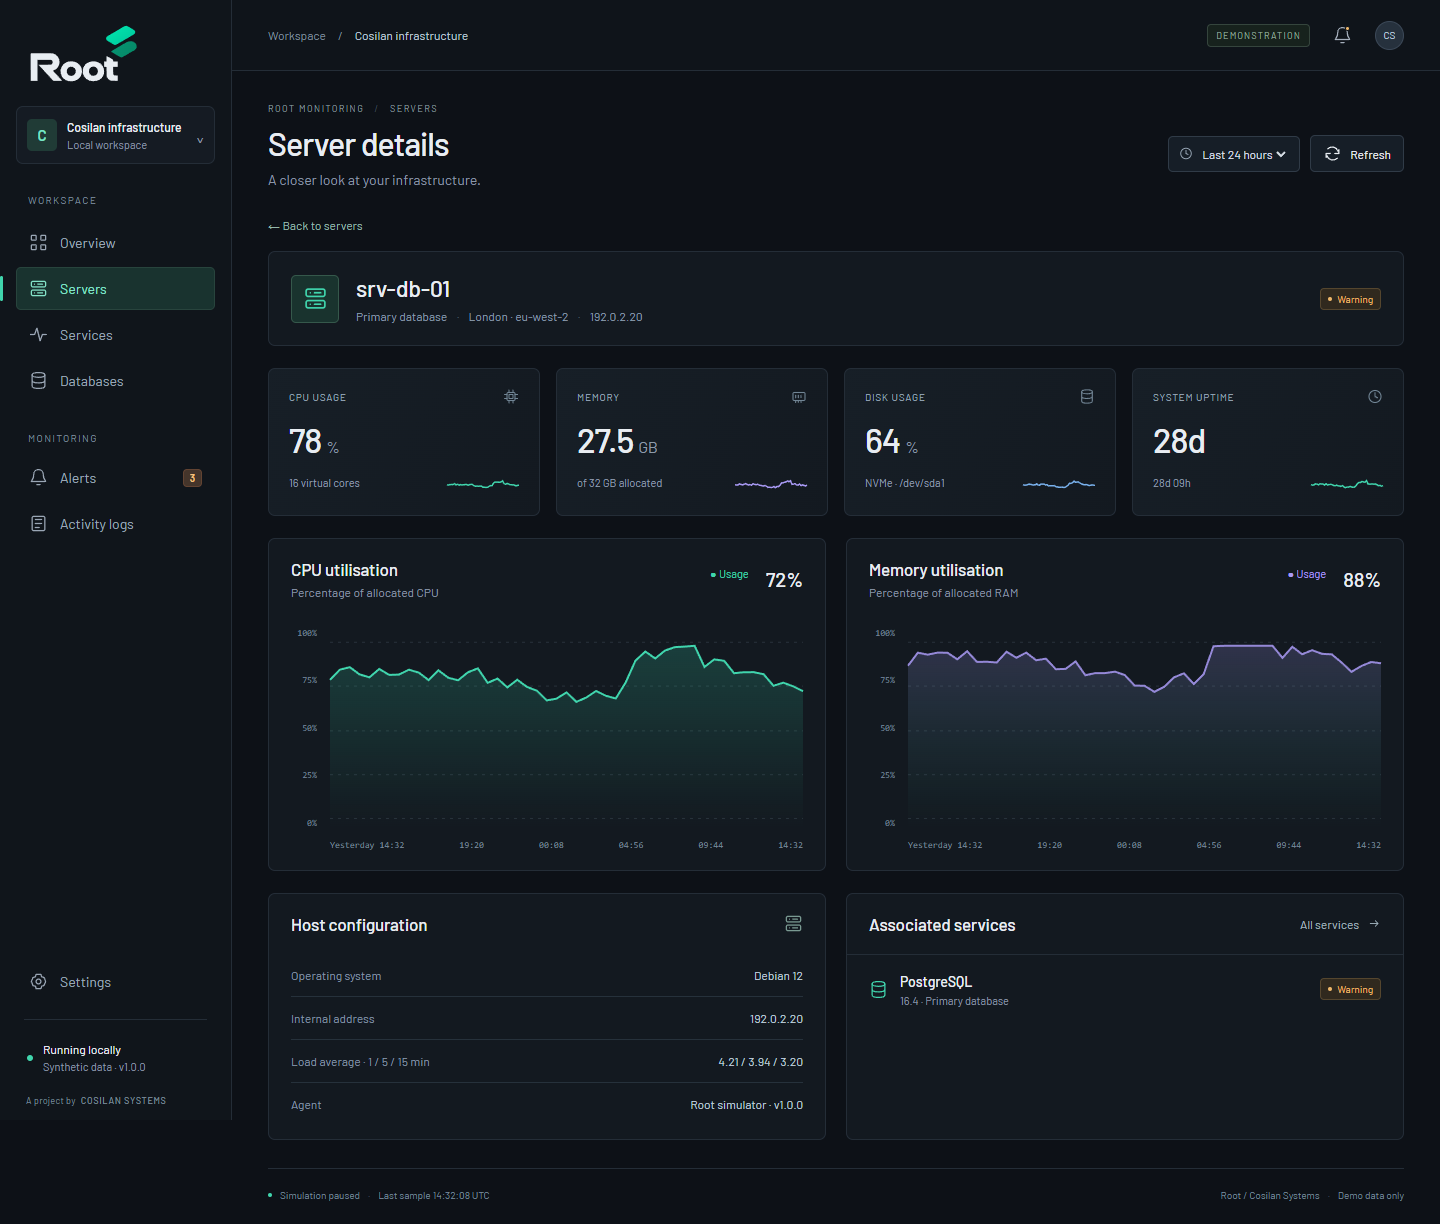
Opening a server reveals its role, region, documentation address, operating system, core allocation, memory capacity and load averages. Separate CPU and RAM charts show the shape of the synthetic workload. The database host deliberately runs at a higher memory utilisation, connecting the warning in the fleet view with the resource figures and service status shown during investigation. Associated services provide another link between infrastructure and the applications it supports.
Chart controls switch between an hour, six hours, a day and a week. Each selection generates a deterministic observation series with an appropriate time scale; refreshing advances the synthetic window. SVG line and area charts keep the implementation compact, with native point tooltips exposing individual percentages. An offline host is explicitly identified, and its charts are described as the last simulated observation window. Missing host identifiers and unknown screens provide recovery links, so direct navigation remains understandable.
04 / Service health
Health beyond the machine.
The service screen covers a reverse proxy, PostgreSQL, a Node.js API, Redis, a queue worker and a backup agent. Each service card combines availability, version, host, a role-specific operating figure, response time and an illustrative uptime percentage. These measures have explicit units: requests per minute, active connections, cache hit rate or jobs per hour. Search and status filters make the same interaction pattern available across both services and servers.
The visual system uses dark slate surfaces, restrained borders and Root's mint identity. Violet distinguishes memory, amber identifies warnings and muted red marks failures. Colour is reinforced with status text and numeric values. A stable sidebar, clear heading hierarchy and compact labels make dense operational information easier to scan. Locally served typography avoids a font-service dependency, while visible keyboard focus, labelled inputs, a skip link and reduced-motion support address practical accessibility needs. The interface presents enough detail to investigate without imitating a full enterprise administration suite.
05 / SQL workloads
SQL workload, made visible.
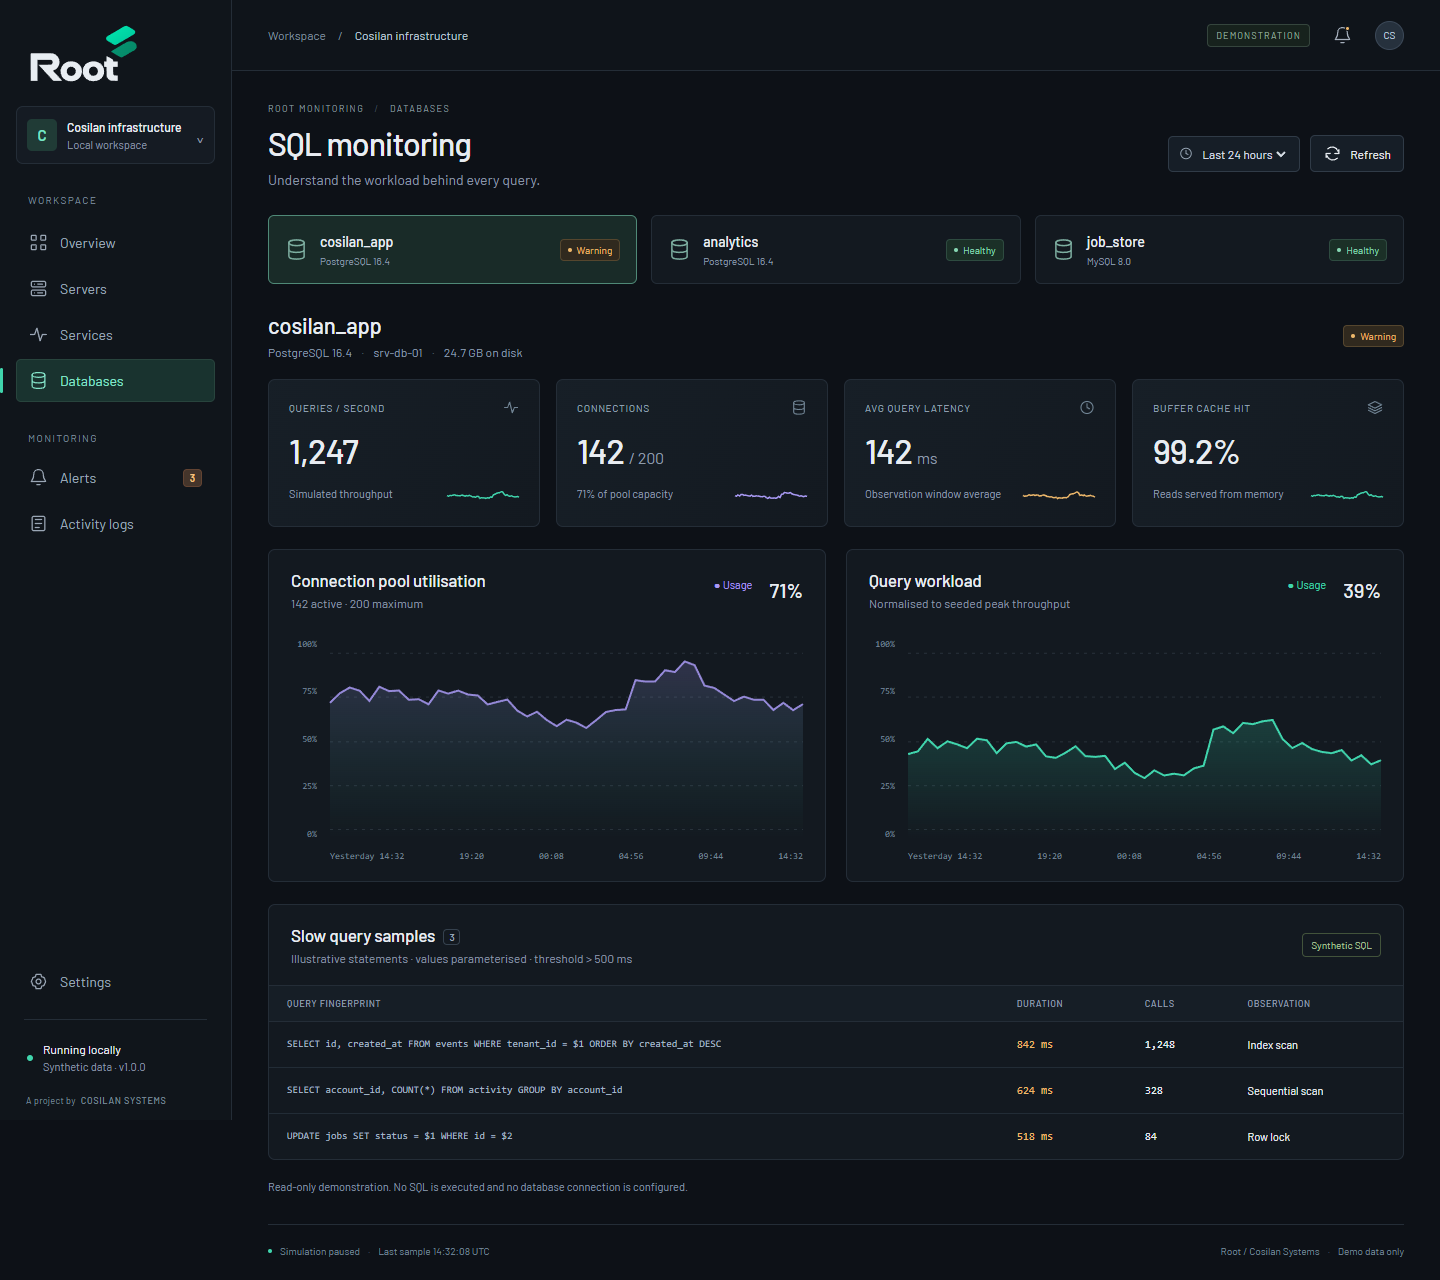
The SQL screen models three databases: an application database, an analytics store and a job store. Selecting one changes the engine, host, storage size, query throughput, connection limits, average latency and buffer-cache figure. Connection-pool utilisation is plotted as a percentage of capacity. A separate workload chart is explicitly normalised to a seeded peak, keeping its percentage scale distinct from the queries-per-second headline.
The application database includes three illustrative slow-query fingerprints, with durations, call counts and observations such as an index scan or row lock. Parameter placeholders avoid presenting literal user data, and a visible synthetic-SQL label establishes the source of the examples. The other database selections demonstrate the healthy empty state. No query can be executed through this interface, and no SQL driver, database credential or running database is required. The purpose is to demonstrate how workload information can be organised for investigation, rather than claim an implemented database collector.
06 / Incident lifecycle
An incident has a lifecycle.
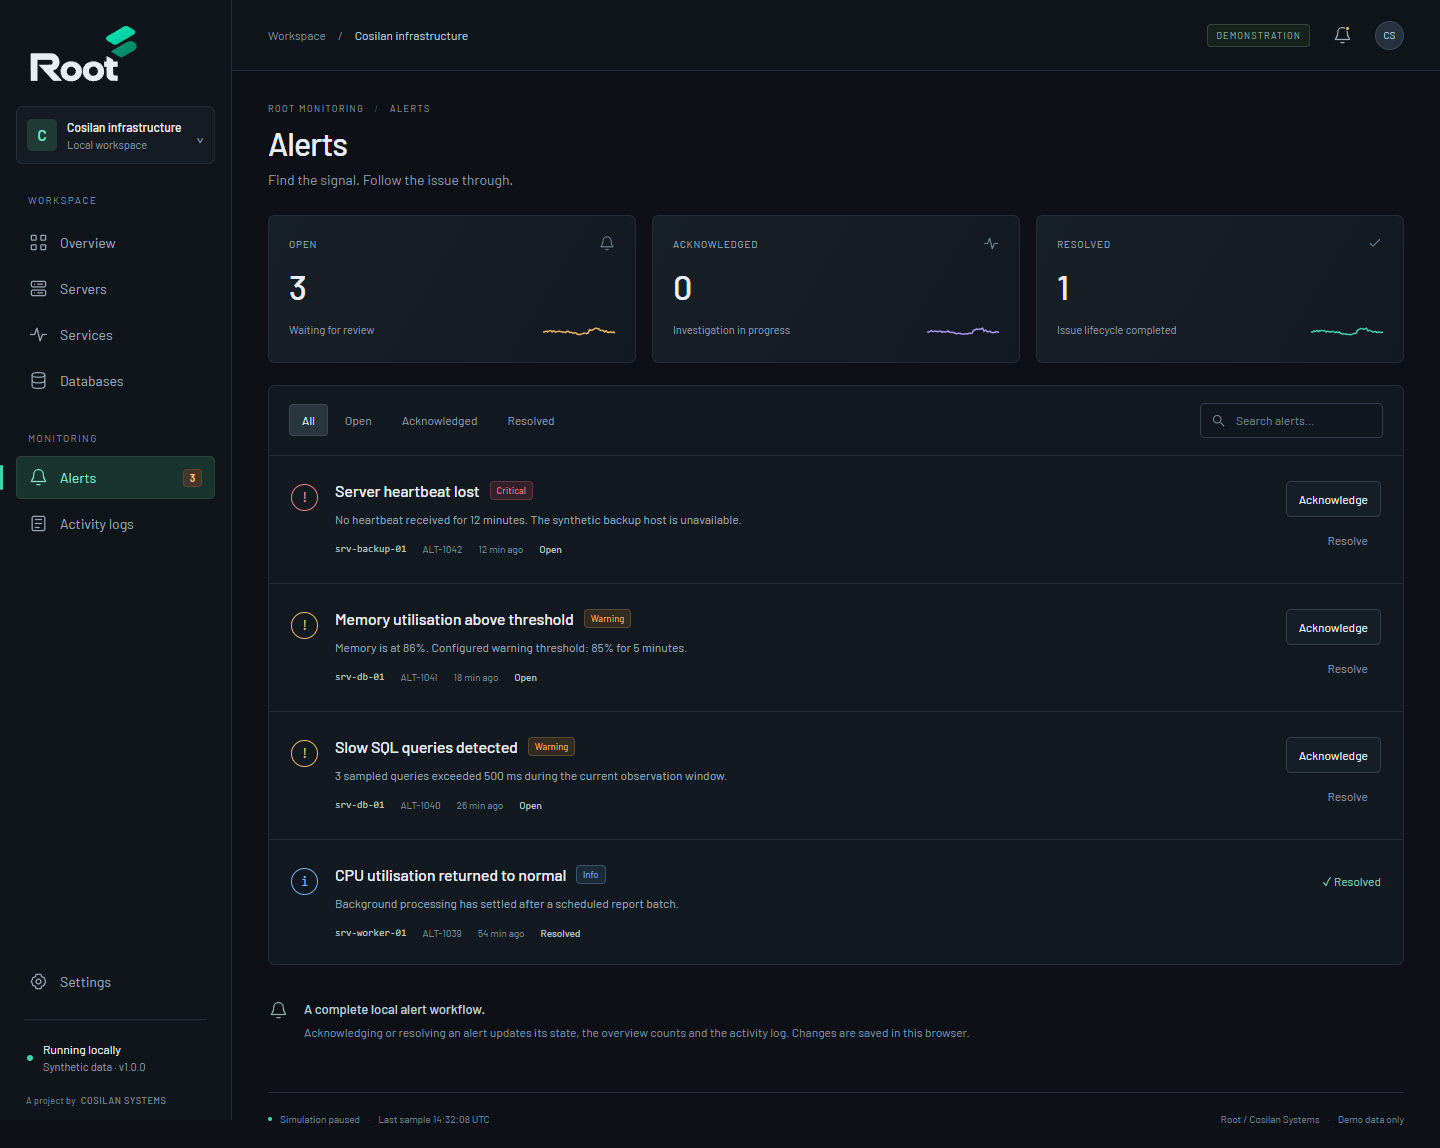
The seeded scenario includes a lost backup-host heartbeat, elevated database memory and slow SQL queries, alongside a previously resolved CPU event. Each alert has an identifier, severity, host, explanation and status. An operator can acknowledge an open alert and then resolve it. Status filters separate outstanding work from completed incidents, while host links preserve the route back to the affected machine.
These actions change application state rather than simply display a notification. Overview counts and navigation badges update, and a corresponding entry appears in the session activity log. Alert states persist in browser local storage, allowing the workflow to survive a reload. Persistence belongs to the current browser; it is not a shared incident database. The service-status fixtures remain independent of manual incident resolution, reflecting the distinction between closing a demonstration workflow and repairing an actual host.
07 / Activity & verification
A readable record of activity.
Activity logs combine seeded system observations with actions taken in the current session. Timestamps, levels, hosts and sources are separated from the message, making the table useful for scanning. Severity filters and free-text search work together, and JSON export includes only the records selected by those controls. Seeded timestamps use a fixed demonstration date; newly recorded actions use the current UTC time. Session events clear on reload, which is stated beside the log.
The supplied pack records Playwright checks against the running local application, covering chart controls, host searches, service filters, database selection, persistent alert transitions, filtered exports, saved preferences and recovery states. It also records mobile overflow checks across eight screens, browser error checks and unexpected external-request checks. The pack includes eight original Chromium screenshots and a provenance manifest recording their routes, viewport and capture times. Selected views appear in this case study.
08 / Local architecture
Small enough to run and understand.
Root uses browser-native HTML, CSS and JavaScript, served by a small Node.js HTTP server. Fixture records and a seeded pseudo-random series generator are separated from rendering and interaction logic. Hash-based routes support direct links without a routing dependency. SVG supplies charts and icons, and local storage holds workspace preferences and alert decisions. There are no runtime packages, external API calls, accounts, telemetry collectors or database services to configure.
Settings control the workspace name, simulation interval, automatic refresh and visual CPU and memory warning thresholds. Saving applies those preferences locally; reset restores the original scenario. The server defaults to the loopback interface, serves only the public asset directory and sets a content-security policy. Root is therefore straightforward to inspect and self-host for demonstration. A production monitoring platform would require a separate collection pipeline, authenticated access, durable time-series storage and operational alert delivery. Those are future architectural concerns, clearly outside this project's implemented scope.